
2026灣區亞裔超市消費趨勢與滿意度調查。
調查單位 / Survey by: News for Chinese 老中地方新聞 / BayArea Smart Buy 灣區超市買買買
初步結果截至 / Preliminary results through: September 28, 2026
回覆數 / Responses: 258
不同電子郵件地址 / Distinct email addresses: 252
【中文報告】
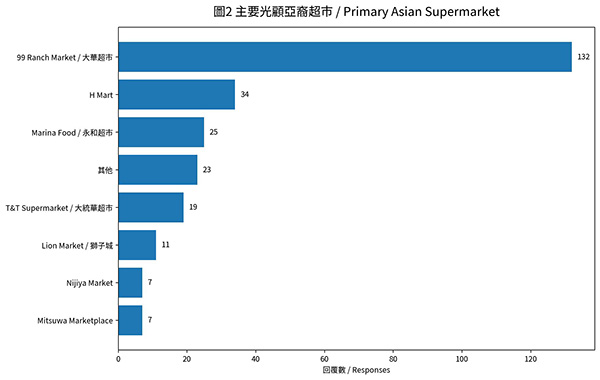
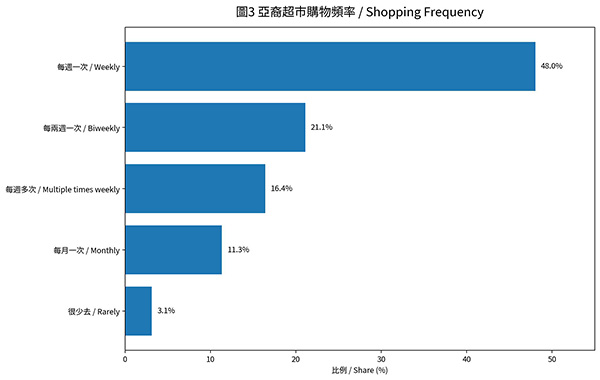
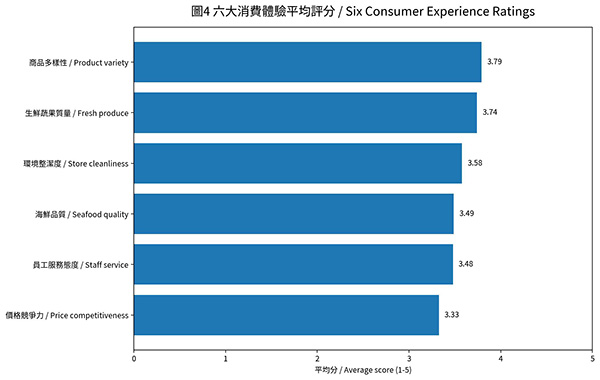
截至2026年9月29日,本調查共收到258份回覆。問卷正式截止日為9月30日,因此本報告屬截止前初步版,最終總數可能小幅變動。資料顯示,參與者對亞裔超市具有高度購物黏著度:在256份回答購物頻率的回覆中,64.5%至少每週光顧一次;若包括每兩週一次者,比例達85.5%。
主要發現
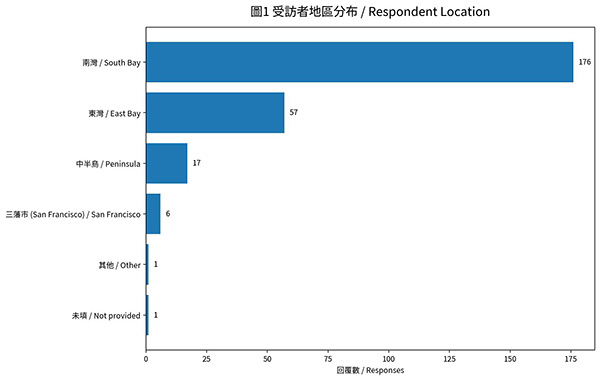
1. 地區:南灣176份(68.2%)、東灣57份(22.1%),兩區合計90.3%。
2. 主要光顧品牌:99 Ranch Market(大華超市)132份(51.2%)最多。這是問卷參與者的主要購物選擇,不是依營業額計算的市場占有率。
3. 購物頻率:64.5%至少每週一次,顯示亞裔超市對許多參與者而言屬日常消費通路。
4. 六大體驗指標:商品多樣性平均3.79/5最高;生鮮蔬果3.74/5次之;價格競爭力3.33/5最低。
5. 滿意率:商品多樣性「滿意或非常滿意」67.4%;生鮮蔬果63.7%;價格競爭力37.6%。
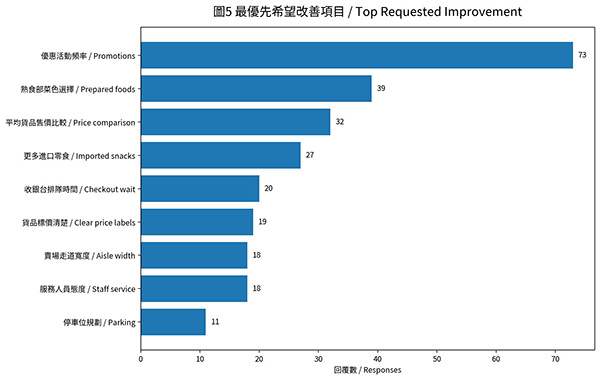
6. 最優先希望改善項目:優惠活動頻率73份居首,其次為熟食部菜色選擇39份、平均貨品售價比較32份,以及更多進口零食27份。
消費者意見
開放式留言反覆提到新鮮度、保存期限、清潔衛生、熟食品質、價格、商品標示、服務態度,以及希望增加台灣、日本、韓國與其他亞洲地區商品。這些留言反映個別參與者的經驗與意見,不代表本報告對任何特定商家的獨立查證。
品牌比較
本報告可比較不同品牌在生鮮蔬果、海鮮、價格、商品多樣性、環境整潔及員工服務六項指標的平均分。由於各品牌樣本數差距很大,公開圖表只將樣本數至少10份的品牌作較醒目的比較;Nijiya與Mitsuwa各只有7份,因此不宜用來作「最佳超市」排行榜式結論。
此次調查顯示,亞洲食品「買得到」已只是基本條件。參與調查的消費者同時關注新鮮度、價格、促銷、熟食、清潔、服務及整體購物體驗。對灣區亞裔超市而言,下一階段競爭很可能不只是商品種類,而是誰能提供更穩定、更值得消費者再次回來的整體價值。
調查方法與限制
本資料包含258份提交紀錄及252個不同電子郵件地址,代表少數參與者曾重複提交;其中至少一位明確表示第二次提交是為補充意見。因此報告使用「258份回覆」,而不是「258名不同受訪者」。本調查屬自願參與的社群問卷,不是依灣區人口結構加權的機率隨機抽樣;南灣與東灣占回覆的大多數,因此結果適合描述參與者的消費經驗與趨勢,不應直接推估為全灣區所有亞裔居民的精確人口比例。
編者註:
感謝大家參與!3位幸運得獎者已公平抽出 讓我們一起恭喜三位團友
《老中地方新聞 News for Chinese》與「灣區超市買買買 BayArea Smart Buy」舉辦的 2026灣區亞裔超市消費趨勢與滿意度調查,感謝灣區民眾熱烈參與並提供寶貴意見。
為確保抽獎公平,我們先將問卷中的重複電郵地址剔除,以 252個不同的有效電郵地址建立抽獎名單,確保每個電郵只有一次抽獎機會,不會因重複提交問卷而提高中獎機率。
之後使用電腦的隨機抽樣程式(random selection),從252個不同電郵地址中隨機抽出3個不同地址。抽獎過程完全不考慮參加者的居住地區、經常光顧的超市、滿意度評分或留言內容,每位符合資格的參加者均有相同的抽獎機會。
再次衷心感謝每一位參與調查的灣區朋友!大家提供的意見將協助我們更深入了解灣區消費者對亞裔超市在商品、價格、生鮮、熟食、環境與服務等方面的實際需求。
2026 Bay Area Asian Supermarket Consumer Trends & Satisfaction Survey 【ENGLISH REPORT】
As of September 29, 2026, the survey had received 258 submitted responses. Because the questionnaire officially closes on September 30, this is a preliminary pre-close report and final totals may change slightly.
The survey points to a highly engaged Asian-supermarket customer base. Among 256 responses that provided shopping frequency, 64.5% reported visiting an Asian supermarket at least weekly. Including those shopping every two weeks, the share rises to 85.5%.
Key Findings
1. Geography: 176 responses (68.2%) came from the South Bay and 57 (22.1%) from the East Bay, together accounting for 90.3%.
2. Primary supermarket: 99 Ranch Market was identified as the primary supermarket in 132 responses (51.2%). This measures respondents’ primary shopping choice, not sales-based retail market share.
3. Shopping frequency: 64.5% shop at an Asian supermarket at least weekly.
4. Six experience indicators: Product variety received the highest average rating at 3.79/5, followed by fresh produce at 3.74/5. Price competitiveness was lowest at 3.33/5.
5. Satisfaction rates: 67.4% were satisfied or very satisfied with product variety, 63.7% with fresh produce, and 37.6% with price competitiveness.
6. Top requested improvement: Promotion frequency received 73 responses, followed by prepared-food selection (39), price comparison (32), and more imported snacks (27).
Consumer Comments
Open-ended comments repeatedly mentioned freshness, expiration-date management, cleanliness, prepared-food quality, pricing, labeling, service and greater availability of Taiwanese, Japanese, Korean and other Asian products. These comments represent individual participants’ experiences and opinions and should not be interpreted as independent verification of conditions at any particular retailer.
Brand Comparison
The survey allows comparison across six categories: fresh produce, seafood quality, price competitiveness, product variety, store cleanliness and staff service. Sample sizes differ substantially by brand. For public-facing comparison, the report emphasizes brands with at least 10 responses; Nijiya and Mitsuwa each have only seven responses, so their results should not be used to support a “best supermarket” ranking.
The findings suggest that simply making Asian products available is no longer enough. Participating consumers also care about freshness, price, promotions, prepared foods, cleanliness, service and the overall shopping experience. The next stage of competition in Bay Area Asian grocery retail may therefore depend on which stores deliver the strongest overall value and experience.
Methodology and Limitations
The dataset contains 258 submitted responses associated with 252 distinct email addresses, indicating a small number of repeat submissions. At least one participant explicitly said a second submission was made to add a comment. The report therefore refers to 258 responses, not 258 unique respondents. This was a voluntary community survey, not a probability-based random sample weighted to Bay Area demographics. The South Bay and East Bay account for most responses, so the findings describe participating consumers and should not be treated as precise population estimates for all Bay Area Asian residents.
© 2026 News for Chinese / BayArea Smart Buy